Viewing Gaussian(c) Cube Files Using AVS and AVS Express
| Ken Flurchick |
and |
Libero Bartolotti |
| Ohio Supercomputer Center |
|
North Carolina Supercomputing Center |
| 1224 Kinnear Rd |
|
3021 Cornwallis Rd |
| Columbus, OH 43212 |
|
Research Triangle Park, NC 27709 |
Abstract
In this article we present two AVS/EXPRESS modules which read the geometric
structure and electronic properties of a molecular system from the CUBE
output generated by the GAUSSIAN(c) package[6]. These modules are, in part,
extensions from previous work, namely the AVS5 modules coord_to_geom
and CUBE_to_Field. Electronic and structural information is obtained
from either Density Functional Theory or Schrödinger Theory, using the
GAUSSIAN(c) code. These modules, in conjunction with the built-in
visualization modules, can display the geometric structure with electronic
properties. In addition, using the enhanced User Interface capabilities in
AVS/EXPRESS, a more user-friendly front-end has been developed. The
capabilities of these modules will be discussed using several examples from
current research activities.
Introduction
Visualizing the results from quantum chemistry calculations is an important
tool for scientists. Several AVS5 modules[1] were written to process the
data from a number of quantum chemistry programs and have been restructured
to utilize the enhanced User Interface capabilities of AVS/EXPRESS plus the
easier data structure to pass array objects to construct the field data.
We call this set of modules the Simple Molecular Display (SMD).
Quantum Mechanics Calculations
The quantum chemistry packages calculate electron densities using either
Density Functional Theory (DFT) via the Kohn-Sham (KS)[2] orbital-density
equations:
where Ck is the basis function and
the C k are the expansion coefficients or
wave function functional theory via the Schr&omul;dinger equation;
where the Fock matrix Fmn is
given by,
where Dls
= S
i
cil
ci
s
is the density matrix and S
mn is the overlap
matrix which arises from the non-orthogonality of the basis functions.
For additional information about the different methodologies, see Szabo Ostlundslund[3], Parr and Yang[4] and Boyd et.al.[5]. The electron density
contains both quantitative and qualitative information about the system
of interest. Molecular properties can be determined from the electron
density such as molecular bonding, reactivity indices, electrostatic
potentials and aromatitcity.
The computational chemistry code GAUSSIAN is widely used by chemists, and
can output a variety of molecular properties in addition to the molecular
structure. Some of the molecular properties are:
- the Highest Occupied Molecular Orbital
(HOMO) determined by solving the Schrödinger equation described
above
- the electronic charge density computed from the sum of the squares
of the molecular orbitals namely,
where N is the number of electrons in the molecule, ni
is the number of electrons in the ith molecular orbital
- the electrostatic potential (ESP) which is written as,
where, Za is the nuclear
charge on the ath nuclear
center in the molecule and r(r
1) is the electron density
- the Laplacian of the density, whose zero-envelope defines a
reactivity surface[7]
AVS/EXPRESS Modules
To display the molecular properties, the visualization process begins by
reading the molecular structure and electronic property information and
converting this information to AVS/EXPRESS objects. This is accomplished
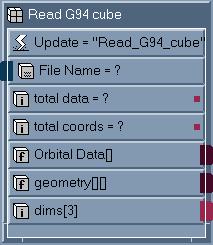
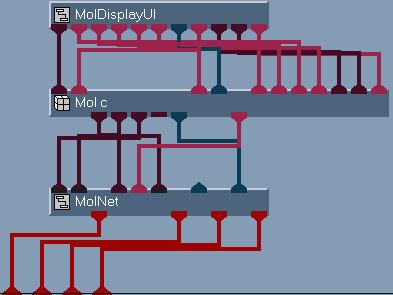
by the AVS/EXPRESS module mol_c and Read_G94_cube. Figure 1
shows the subobjects in the modules mol_c and Figure 2 shows the
subobjects of Read_G94_cube.
Figure 1
Subobject
list for the
module
mol_c
|
|
|
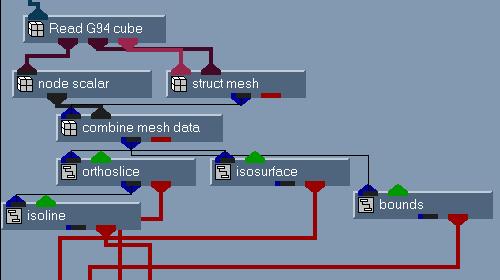
Figure 2
Subobject list
for the module
Read_G94_cube
|
|
One important point to note is that the module mol_c outputs arrays
of numbers which represent the atomic centers (array a_lst), atom colors
(array rgb_lst), atomic radii (array r_lst) and bonding information (array
connect_lst). The information is then passed to AVS/EXPRESS mesh modules.
The module Read_G94_cube output both mesh coordinates array geometry)
and the molecular property information (array Orbital_Data).
For the molecular structure, the modules point mesh (renamed as atomic point
mesh), node color (renamed as atomic mesh color), node radii (renamed as
atomic radii) and combine mesh (renamed as atomic field) are used (see
figure 3) to create the molecular structure field.
Figure 3
Network to create
molecular structure
field.
|
|
For the electronic structure (the ESP, HOMO and electron density), the
modules struct mesh (structured mesh), node scalar (the
molecular property data), and combine mesh data are used (see
figure 4) to create the molecular property field. The field data is the
passed to the usual bounds, isosurface and isoline modules
to display the data.
Figure 4
Network for the
molecular property
display.
|
|
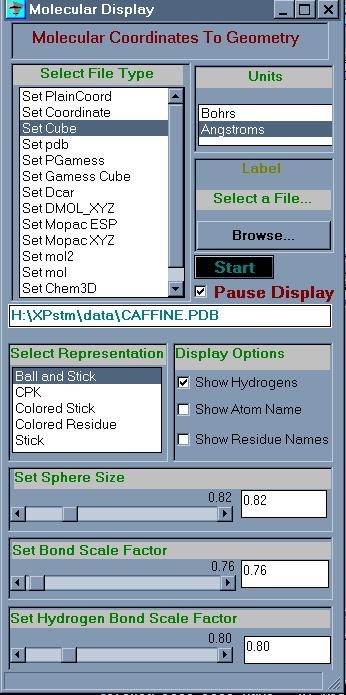
In addition to the modules mol_c and Read_G94_cube, the user
interface was designed using the interface modules (UI Kit). The UI kit
contains numerous modules to manipulate windows, frames and widgets as part
of the user interface. The UI for the molecular structure part is shown in
figure 5. The parameters to select the type of file to read, the file name
and the units parameters are options to select. The display options
are in the bottom part of the UI, the type of display, options to display
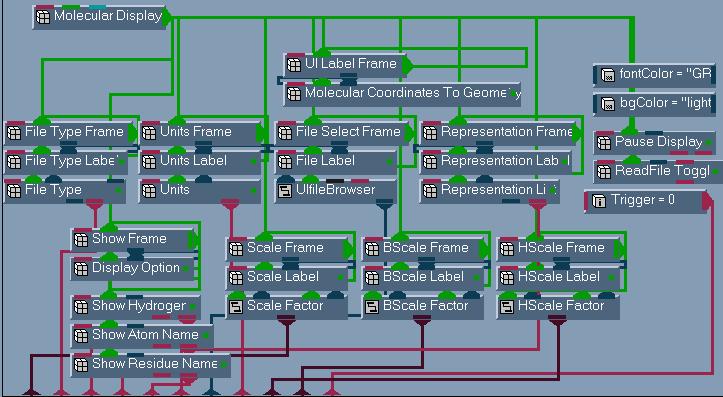
atom names and so on. The entire interface is constructed from modules
built into AVS/EXPRESS, no additional coding was necessary. The network to
construct the UI is shown in figure 6.
Figure 5
UI for
mol_c.
|
|
| |
| |
Figure 6
Network to
construct
the mol_c
UI.
|
|
Results
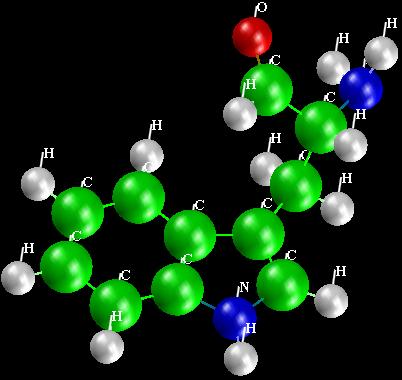
To demonstrate the use of these modules, we show various displays of the
molecular system tryptophan (C11H12N2O).
The structure and molecular properties were computed using GAUSSIAN 94[6].
Figure 7 shows three views of the display, the most common type of display
is shown, namely the geometry of the molecule. Three different types of
structure displays are shown. The upper left is CPK, upper right is
ball_and_stick and the bottom image shows the structure labeled by atom
names.
Figure 7
Display of
Tryptophan.
|
|
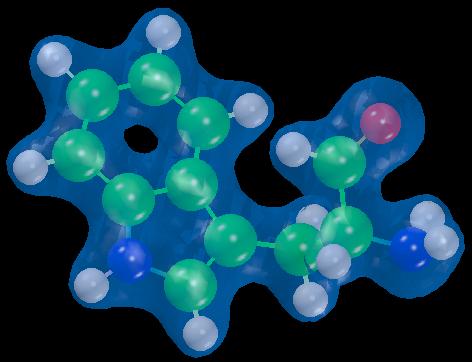
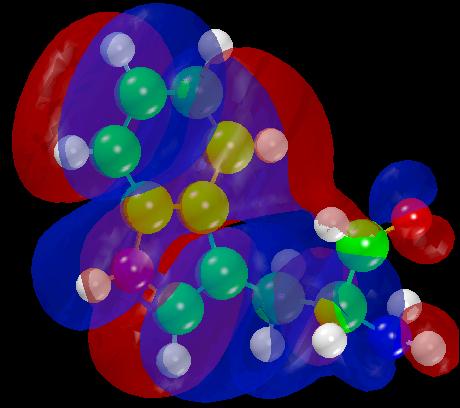
The next two figures show the capabilities of combining AVS and results
from calculations. Figure 8 shows the electron density plus the molecular
structure and figure 9 depicts the HOMO and the molecular structure.
Figure 8
Electronic
shape of
Tryptophan.
|
|
| |
| |
Figure 9
HOMO
display of
Tryptophan.
|
|
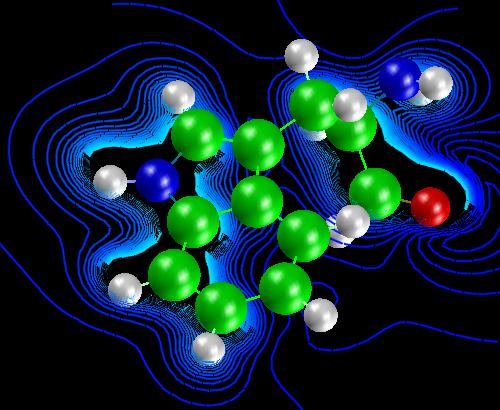
Lastly, we show in figure 10, some contour lines of the electrostatic
potential. Also in the image, is the 3D viewer used to display the results
in AVS/EXPRESS.
Figure 10
Electrostatic
potential contours
of Tryptophan.
|
|
References
- K.M. Flurchick and Lee Bartolotti,
"Visualizing Properties of Atomic and Molecular Systems",
Journal of Molecular Graphics, 13, 10, (1995). And K. Flurchick,
Lee Bartolotti and Mark Reed,
"Visualizing Properties of Atomic and Molecular Systems in AVS",
AVS'94 Proceedings.
- W. Kohn and L.J. Sham, Phys. Rev. 140, A1133 (1965)
- Modern Quantum Chemistry, Atilla Szabo and Neil Ostlund, MacMillan
Publishing Co. N.Y. 1982
- W.G. Parr and W. Yang, Density-Functional Theory of Atoms and
Molecules Oxford University Press, New York, 1989
- Reviews in Computational Chemistry, Kenny B. Lipkowitz and Donald B.
Boyd, eds. VCH, New York 1992
- Gaussian 94, Revision E.1, M. J. Frisch, G. W. Trucks, H. B. Schlegel,
P. M. W. Gill,B. G. Johnson, M. A. Robb, J. R. Cheeseman, T. Keith,G.
A. Petersson, J. A. Montgomery, K. Raghavachari, M. A. Al-Laham,
V. G. Zakrzewski, J. V. Ortiz, J. B. Foresman, J. Cioslowski,
B. B. Stefanov, A. Nanayakkara, M. Challacombe, C. Y. Peng,
P. Y. Ayala, W. Chen, M. W. Wong, J. L. Andres, E. S. Replogle,
R. Gomperts, R. L. Martin, D. J. Fox, J. S. Binkley, D. J. Defrees,
J. Baker, J. P. Stewart, M. Head-Gordon, C. Gonzalez, and J. A. Pople,
Gaussian, Inc., Pittsburgh PA, 1995.
- Atoms in Molecules: A Quantum Theory, R.F.W. Bader, Claredon Press,
Oxford 1994.
 where, Za is the nuclear
charge on the ath nuclear
center in the molecule and r(r
1) is the electron density
where, Za is the nuclear
charge on the ath nuclear
center in the molecule and r(r
1) is the electron density